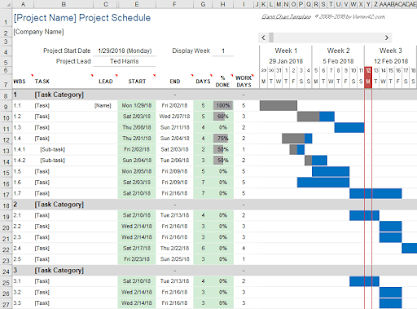
A Gantt chart is a tool for project management developed originally by Henry Gantt in the early 1900s. It is a type of bar chart that shows the start and end times for each task in a project schedule. The tasks are usually categorized using a work breakdown structure with summary tasks for the main project deliverables and sub-tasks that break the project down into a detailed and manageable task hierarchy. If you use Excel or Google Sheets, you can create this type of project schedule with almost no learning curve by downloading free Gantt Chart Template.
Tags:
business expense

